Case study: a site crashes every time a post is saved — from Apache to MySQL
Every time an editor saved a post, the server went into a tailspin: hundreds of Apache processes, 504s and only a hard reboot helped. The CMS developers said 'not our problem'. Here's how we traced the chain from nginx to MySQL and what fixed it.
Translated from the Russian original. Русская версия
This was my first properly documented performance case — in a way, it’s where this blog started. A customer ordered paid administration work on their cloud server. All data is anonymized: the names of the site, the server and the database are changed.
Starting point
| Parameter | Value |
|---|---|
| Server | cloud VPS, 2 vCPU, 8 GB RAM |
| OS | Ubuntu 22.04 |
| Panel | ISPmanager |
| Stack | nginx → Apache (prefork) → PHP → MySQL 8 |
| Cache | Redis, OPcache |
| Site | a news portal on DLE, tens of thousands of posts with audio |
The complaint: the moment a post is saved, the number of processes spikes, CPU and memory max out, the site returns 504 Gateway Time-Out, and only a forced reboot helps.
The customer first went to the CMS developers. Their answer was logical but useless: “when saving, DLE resets its caches, load goes up, and server tuning is the hosting provider’s job.” That’s how the task reached me.
Step 1. Reproduce the problem
Without reproduction you can tweak settings blindly forever. I asked the customer to create a test post and send me the files editors usually work with. The result: any edit of a post with audio triggered an avalanche — the number of Apache processes grew nonstop until the server hung.
Now there was something to measure.
Step 2. nginx: not enough connections
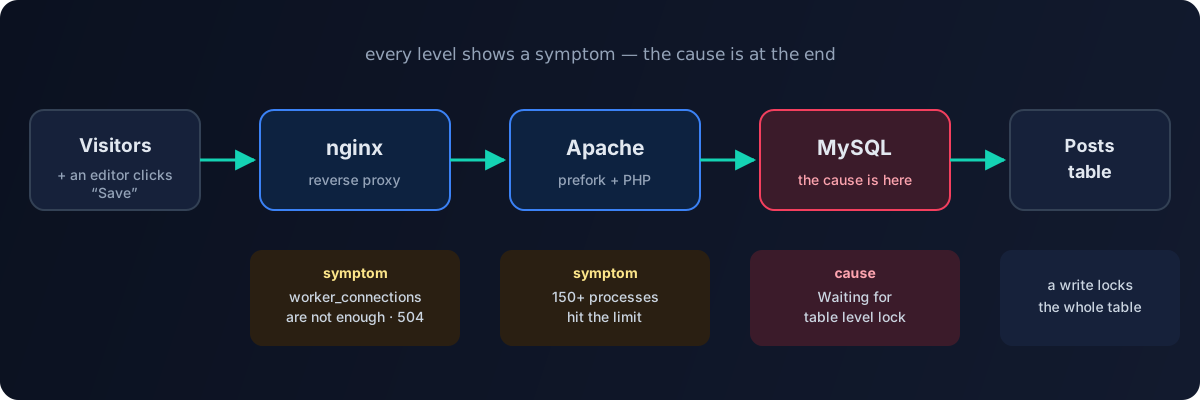
nginx is first in the chain, so I started with its logs:
[alert] 768 worker_connections are not enough
The default 768 connections per worker weren’t enough. I raised the limit and set up buffering of backend responses:
events {
    worker_connections 4096;
}

# in the http / server block
proxy_buffering on;
proxy_buffer_size 4k;
proxy_buffers 32 4k;
proxy_max_temp_file_size 0;
The errors went away, but the site still went down — nginx was simply passing the jam further along.
Step 3. Apache: processes hit the limit
The next level is Apache in prefork mode, where each request takes a separate process. The customer saw more than 150 apache2 processes — exactly as many as the limit allowed. New requests queued up, nginx didn’t wait for a response and returned 504.
I raised the limits in /etc/apache2/mods-available/mpm_prefork.conf:
StartServers            10
MinSpareServers         10
MaxSpareServers         20
ServerLimit             2000
MaxRequestWorkers       1500
MaxConnectionsPerChild  10000
MaxConnectionsPerChild recycles a process after 10,000 requests, which protects against PHP memory leaks.
After that the processes stopped hitting the ceiling, and the whole load moved to the database. That’s an important point: raising limits doesn’t solve the problem, it moves it to the next level. But now you could see where it really was.
Step 4. MySQL: a queue of locks
SHOW PROCESSLIST showed a picture that explained everything:
| Id   | db      | Command | Time | State                        | Info                      |
| 6294 | site_db | Query   |   46 | Waiting for table level lock | SELECT p.id, p.autor, ... |
| 6295 | site_db | Query   |   29 | Waiting for table level lock | SELECT p.id, p.autor, ... |
| 6296 | site_db | Query   |   26 | Waiting for table level lock | SELECT p.id, p.autor, ... |
| 6303 | site_db | Query   |   73 | executing                    | SELECT p.id, p.autor, ... |
...
Dozens of identical SELECTs against the posts table sat in Waiting for table level lock for 30–70 seconds. The mechanics of the jam:
- An editor saves a post — the CMS writes to the posts table and resets its cache.
- The write locks the whole table.
- The cache is gone, so every visitor goes straight to the database — and queues up behind the lock.
- Every waiting query holds an Apache process — processes multiply, memory runs out, the server falls over.
To find out which queries were to blame, I enabled the slow query log and analyzed it with pt-query-digest from Percona Toolkit:
# Overall: 811 total, 23 unique, 1.08 QPS, 88.99x concurrency
# Attribute          total     min     max     avg     95%
# Exec time         66652s      2s    168s     82s    159s
# Lock time         44917s       0    159s     55s    151s

# Rank Response time     Calls R/Call   Item
#    1 31009.2  46.5%      282 109.96   SELECT dle_post dle_post_extras
#    2 18449.6  27.7%      167 110.48   SELECT dle_post dle_post_extras dle_post_extras_cats
#    3  7528.1  11.3%       93  80.95   SELECT dle_post dle_post_extras_cats dle_post_extras
The key numbers: the average query took 82 seconds, of which 55 seconds was waiting for a lock. A concurrency of 89x means about 90 queries were waiting at the same time. The problem wasn’t “heavy” queries — it was that they waited for each other.
Step 5. MySQL configuration
The MySQL config was almost stock, sized for minimal hardware. I brought it in line with an 8 GB server where the database is the main memory consumer:
[mysqld]
# InnoDB: keep data and indexes in memory
innodb_buffer_pool_size      = 4G
innodb_buffer_pool_instances = 4
innodb_log_file_size         = 1G
innodb_flush_method          = O_DIRECT
innodb_read_io_threads       = 8
innodb_write_io_threads      = 8
innodb_lock_wait_timeout     = 50

# Caches and buffers
key_buffer_size    = 64M
table_open_cache   = 2000
sort_buffer_size   = 4M
thread_cache_size  = 100

# Connections
max_connections     = 300
wait_timeout        = 120
interactive_timeout = 120

# Diagnostics
slow_query_log                = 1
slow_query_log_file           = /var/log/mysql/mysql-slow.log
long_query_time               = 1
log_queries_not_using_indexes = 1
What matters most here:
| Setting | Why |
|---|---|
innodb_buffer_pool_size = 4G | half the RAM for caching data and indexes: queries read from memory, not disk |
innodb_flush_method = O_DIRECT | no double caching in InnoDB and the OS page cache |
innodb_log_file_size = 1G | fewer log flushes on writes |
table_open_cache, thread_cache_size | less overhead opening tables and creating threads |
max_connections = 300 | a limit consistent with memory: every connection uses RAM too |
slow_query_log | ongoing monitoring so the next problem is visible right away |
Along the way I removed the query_cache_* settings from the config — the query cache is gone in MySQL 8, and such lines stop the server from starting.
Result
After the changes the avalanche on post save disappeared. SHOW PROCESSLIST during an edit showed a few idle service connections and not a single lock wait. A fresh slow log analysis:
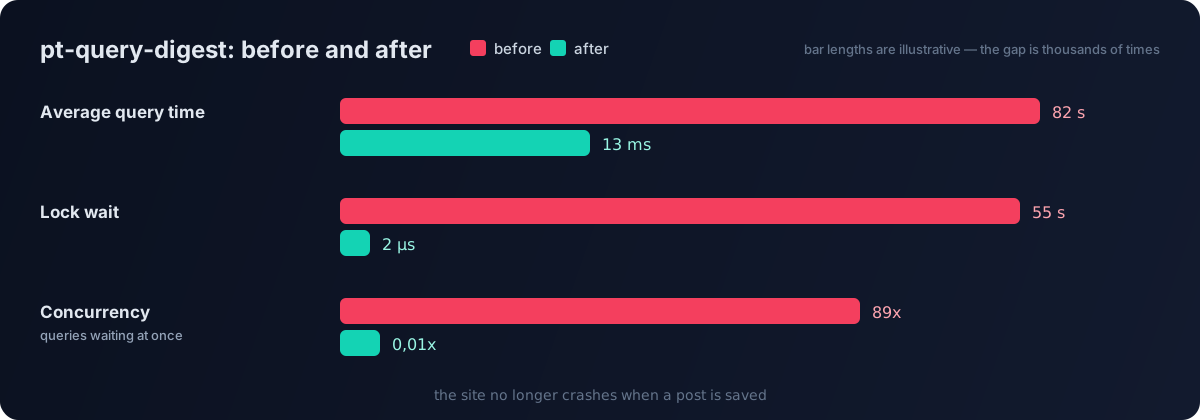
| Metric | Before | After |
|---|---|---|
| Average query time | 82 s | 13 ms |
| Average lock wait | 55 s | 2 µs |
| Concurrency | 89x | 0.01x |
| Queries in the slow log over ~10 minutes | 811 | 278 |
Most queries now run in 100 µs – 1 ms. Some slow queries remained — for example, a selection with NOT IN (subquery) sorted by view count that examines 228 thousand rows — but they no longer block the whole site.
What I’d do differently today
This was my first serious performance investigation. Rereading it later, I can see what could have been done better:
Check the table engine right away.
Waiting for table level lockis the classic sign of MyISAM tables: they lock entirely on any write. InnoDB locks only the rows it needs. Checking takes one query:SELECT TABLE_NAME, ENGINE FROM information_schema.TABLES WHERE TABLE_SCHEMA = 'site_db' AND ENGINE <> 'InnoDB';Converting old tables to InnoDB (
ALTER TABLE … ENGINE=InnoDB, after a backup) addresses this root cause rather than its symptoms.Be careful with Apache limits.
MaxRequestWorkers 1500on an 8 GB server bets on processes staying light. A prefork process with PHP takes tens of megabytes, and in the next jam such a limit can eat all the memory. It’s better to size the limit from memory — and better still to move to PHP-FPM andmpm_event.Don’t forget the application cache. The jam started because after a post was saved, every visitor hit the database at once. Page caching at the nginx or Redis level smooths out such spikes.
Add indexes for the slow queries. The remaining slow selections are candidates for indexes and an
EXPLAINreview.
Lessons
- Reproduce first, tune second. A test post from the customer saved days of guesswork.
- Follow the request chain. nginx → Apache → PHP → MySQL: each level shows a symptom, the cause is at the end.
- Raising limits moves the problem rather than solving it. But it shows where the real bottleneck is.
- Measure before and after. Without
pt-query-digest, “it got better” would just be a feeling.