SIEM noise: from millions of alerts to an incident queue
A snapshot of a real SIEM at a hosting company: millions of alerts a day, three rules producing almost 90% of the volume, and 'critical' alerts that are almost entirely noise. How to live with it and what to tune.
Translated from the Russian original. Русская версия
Deploying a SIEM is only half the job. A couple of months after launching Wazuh I took a snapshot and realized that watching the dashboard was pointless: alerts poured in at dozens per second, and what the whole thing was built for got lost among them. This article breaks down that snapshot and the model I use to turn a firehose into an incident queue. I described how the cluster itself is built in Building a SOC on Wazuh from scratch.
Server and agent names and exact values are omitted — only shares and orders of magnitude. Rule IDs are standard Wazuh rules.
The scale of the problem
The picture at the time of the snapshot:
- millions of alerts a day — more than 60 per second on average;
- over 100 million alert documents in the index over a few months;
- an extremely uneven distribution: one server produced about 22% of all alerts, and the fifteen noisiest agents more than half.
The cluster itself was healthy: load was spread evenly across worker nodes, shards were in place. The problem wasn’t the infrastructure but what we were turning into alerts.
Who makes the noise: three rules, 90% of the volume
The most useful thing you can do with a noisy SIEM is count alerts by rule. Here’s what I got:
| Rule | What it is | Weekly share |
|---|---|---|
31101 | Web server 4xx response | ~37% |
550 | File checksum changed (FIM) | ~36% |
31410 | PHP warning | ~15% |
| the rest | hundreds of other rules | ~12% |
Two rules make up about three quarters of the volume, three almost 90%. By decoder it’s the same: the vast majority comes from web server access logs and file integrity monitoring.
Why this happens at a hosting company:
- Access logs. Shared hosting has thousands of sites that bots scan around the clock. Every 404 from a scanner is an alert.
- File integrity monitoring (FIM). Sites constantly write caches, sessions, logs and uploads. If FIM watches those directories, every cache write is a “checksum changed”.
- PHP warnings. Old CMSs and plugins spit warnings into the log on every request.
“Just watch the critical ones” doesn’t work
The first idea is to filter by level and only look at level >= 10. Let’s check:
- level 10+ alerts — hundreds of thousands a week, more than two hundred thousand a day;
- about 99% of them are two web correlation rules: “many 4xx errors from one IP” (
31151) and “many POST requests in a short time, probably a bot” (31533).
So correlation on top of noise produces correlated noise. The severity in the stock rules ignores context: for shared hosting, scanning is background, not an incident.
Meanwhile the same snapshot contained genuinely important signals that simply drowned:
- low memory and full file systems on servers;
- agent event queue overflow — the agent can’t send events fast enough and may lose them;
- suspected rootkits, SQL injection and XSS attempts, Shellshock;
- series of failed SMTP authentications.
These are exactly what a SIEM is for, and exactly what needs to be pulled out of the noise.
The model: five layers
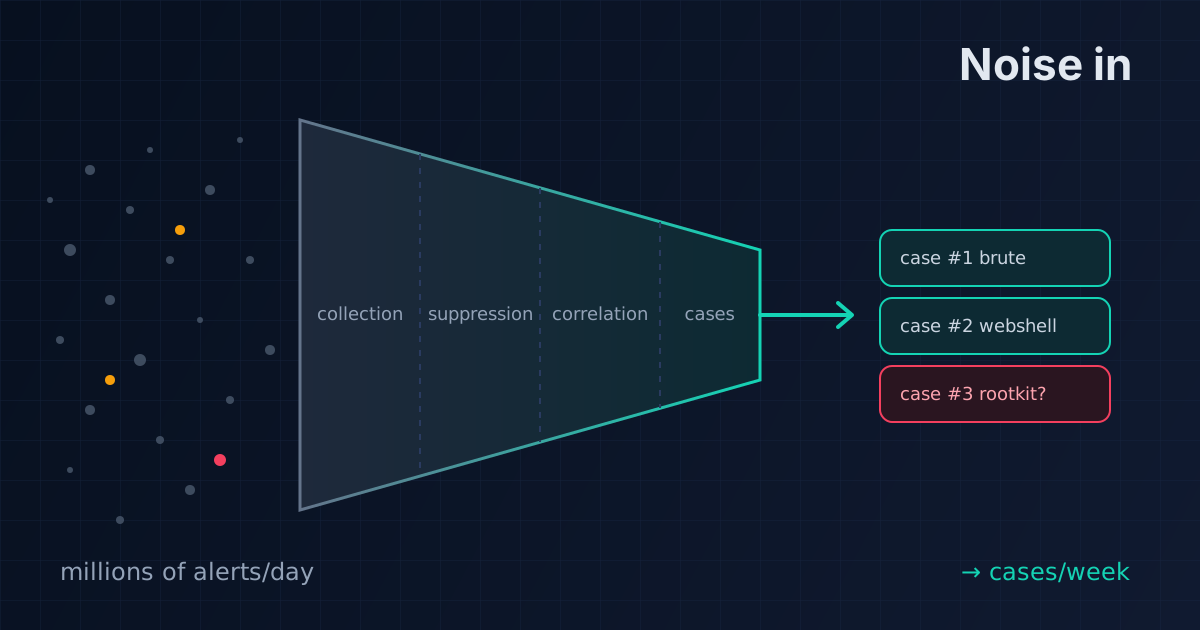
You can’t push every alert into an incident management system — you’d get millions of “cases”. You can’t enrich every alert (GeoIP, reputation, context) either — it’s expensive and pointless. So the model is layered.
1. Collection and normalization
Sources are split by type, and the expected “background” is recorded for each:
- web hosting, databases, internal applications;
- network equipment and firewalls;
- antivirus on workstations;
- workstations and infrastructure servers.
In Wazuh this is conveniently done with agent groups: each group has its own agent.conf — what to collect and what to ignore.
2. Noise suppression
This is where the biggest win is. What to do first:
Exclude constantly changing directories from FIM — caches, temp files, sessions, logs:
<syscheck>
  <ignore type="sregex">/cache/|/tmp/|/sessions?/|\.log$</ignore>
</syscheck>
Integrity monitoring is valuable for code, configs and system files — not for a directory where the CMS writes its cache every five seconds.
Drop low-value rules to level zero with a child rule in local_rules.xml:
<group name="local,noise,">
  <rule id="100200" level="0">
    <if_sid>31410</if_sid>
    <description>PHP warnings on hosting: no alert</description>
  </rule>
</group>
Level 0 events don’t become alerts. If you need raw events for investigations, they can be archived without turning them into alerts.
Be careful with web rules. If you silence the base 4xx rule entirely, the correlations built on it stop firing too. So web hosting deserves its own policy: suppress single errors but keep the signs of a real attack — SQL injection, XSS, Shellshock, path traversal, successful responses to suspicious requests.
3. Correlation into “incident candidates”
An alert becomes a candidate only when conditions combine, never on its own. Examples:
- Authentication: a series of failures + an unusual account + an external source + a critical asset.
- Web attacks: several attack types from one IP + a successful response (200/500) + a protected application rather than a random customer site.
- FIM: a change in a critical path + an unexpected process or user + a production server.
- System health: low memory, a full disk, an agent queue overflow — on a critical asset.
- Workstations: antivirus detected a threat and didn’t clean it automatically, repeated detections, signs of lateral movement.
4. Enrichment
For candidates only:
- asset criticality and service owner;
- the server’s group and role;
- GeoIP, ASN and IP reputation;
- known vulnerabilities on that host;
- related events from the last few hours and past cases.
5. Cases
Only what passes every filter reaches the response system (DFIR-IRIS is on my roadmap). The goal is dozens of meaningful cases a week, not hundreds of thousands of alerts.
Don’t forget the SIEM’s own health
One of the most underrated signals in the snapshot was agent event queue overflow. If an agent on a noisy server can’t send events fast enough, it starts dropping them — and along with the noise it may lose exactly the important event. So reducing noise is not just about analyst comfort, it’s about reliable collection.
How to take a snapshot like this yourself
A few aggregations over the alerts index are enough (in the dashboard or with OpenSearch queries):
- alert counts per day, week and month — the trend;
- the distribution by
rule.level; - the top 20 rules by count;
- the top 20 agents and their main rules;
- the top decoders and sources (
location); - separately — every level 10+ rule with its count.
The first three usually already show where 80–90% of the volume goes.
Takeaways
- SIEM noise is almost always concentrated in a few rules — find them and you’ve solved most of the problem.
- Filtering by severity doesn’t replace tuning: correlation on top of noise gives correlated noise.
- Start with FIM exclusions for caches and logs and with demoting low-value rules — the fastest win.
- Only what has passed suppression, correlation and enrichment should become a case.
- Noise tuning is an ongoing process: take snapshots regularly and compare them with the previous one.