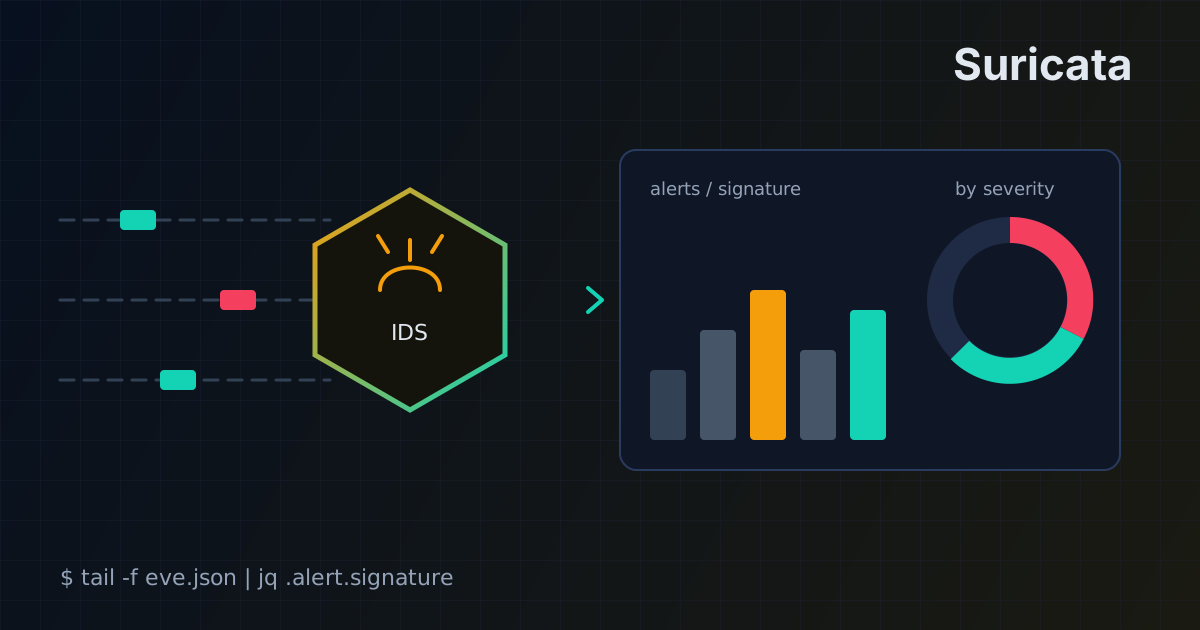
Suricata + ELK: your own network IDS with dashboards
An open-source network IDS: Suricata watches the traffic, suricata-update keeps rules fresh, Kibana and EveBox show the alerts, and Wazuh ties network events to host events.
Translated from the Russian original. Русская версия
Host logs don’t show everything: port scans, exploitation of network services, malicious traffic and suspicious TLS connections are only visible on the network. That’s what a network IDS is for. My choice is Suricata: open source, multithreaded, understands dozens of protocols and writes events to convenient JSON (eve.json).
The layout
traffic (port mirror / the server itself)
        │
        ▼
    Suricata ──► eve.json ──► Logstash/Filebeat ──► Elasticsearch ──► Kibana
                    │                                                 EveBox
                    └──► Wazuh agent ──► SIEM (correlation with hosts)
Suricata can run directly on the server you protect or on a separate machine that receives a copy of the traffic (a switch SPAN port or a TAP).
Installation
On Ubuntu, Suricata is in the standard repositories (for a fresh version use the OISF PPA):
apt update
apt install suricata
suricata --build-info | head
Configuration
The main config is /etc/suricata/suricata.yaml. The minimum you need to change:
The home network — so rules know what’s “ours” and what’s “external”:
vars:
  address-groups:
    HOME_NET: "[10.0.0.0/8,172.16.0.0/12,192.168.0.0/16]"
The capture interface in af-packet mode:
af-packet:
  - interface: eth0
    cluster-id: 99
    cluster-type: cluster_flow
Test the configuration and start:
suricata -T -c /etc/suricata/suricata.yaml -v
systemctl enable --now suricata
Rules: suricata-update
Without rules Suricata detects almost nothing. The modern way to manage them is suricata-update. By default it downloads the free Emerging Threats Open set, applies filters and builds everything into a single file, /var/lib/suricata/rules/suricata.rules:
suricata-update
Point Suricata’s config at that path:
default-rule-path: /var/lib/suricata/rules
rule-files:
  - suricata.rules
Additional rule sources:
suricata-update update-sources     # refresh the source index
suricata-update list-sources       # see what's available
suricata-update enable-source oisf/trafficid
suricata-update enable-source sslbl/ssl-fp-blacklist
suricata-update
Sources include free ones (ET Open, OISF Traffic ID, abuse.ch lists) and commercial ones (ET Pro and others) that need a subscription key.
Fine-tuning is done with enable.conf, disable.conf, drop.conf and modify.conf in /etc/suricata/: disable noisy rules, switch the ones you need to blocking mode (for IPS), change parameters. Rule updates are worth putting on cron followed by suricatasc -c reload-rules.
Checking that detection works:
curl http://testmynids.org/uid/index.html
grep -i "GPL ATTACK_RESPONSE" /var/log/suricata/fast.log
Visualization: ELK and EveBox
Suricata writes events to /var/log/suricata/eve.json. Next they need to go somewhere.
Elasticsearch + Kibana. Logstash or Filebeat (Filebeat has a ready-made Suricata module) ships eve.json to Elasticsearch, and Kibana builds dashboards:
- a map of alerts by country (GeoIP);
- the top 10 triggered rules;
- alert counts by rule set;
- top source and destination IPs and ports;
- a table with the details of each alert.
Ready-made Suricata dashboards come with the Filebeat module and in open repositories — import them via Stack Management → Saved Objects and adapt them to your needs.
EveBox is a lightweight web UI built specifically for Suricata alerts: it’s handy for reviewing events one by one, marking them as reviewed and looking at related flows. It complements Kibana well.
Elasticsearch is memory-hungry: on a small machine limit the heap in jvm.options (for example -Xms1g -Xmx1g) and set up index rotation, or the disk will fill up faster than you expect.
Don’t expose Kibana to the internet
Kibana and EveBox listen on local ports (5601, 5636). Publish them only through a reverse proxy with TLS and access restrictions:
server {
    listen 443 ssl;
    server_name ids.example.com;

    # ssl_certificate ... ; ssl_certificate_key ... ;

    allow 10.0.0.0/8;     # VPN / office
    deny  all;

    location / {
        proxy_pass http://127.0.0.1:5601;
        proxy_set_header Host $host;
        proxy_set_header X-Real-IP $remote_addr;
    }
}
Add Elastic’s built-in authentication or at least basic auth on the proxy. An IDS with a publicly exposed dashboard is a gift to an attacker: it shows what you detect and what you don’t.
Integration with Wazuh
If you already run a Wazuh SIEM, it’s convenient to have the Wazuh agent read eve.json:
<localfile>
  <log_format>json</log_format>
  <location>/var/log/suricata/eve.json</location>
</localfile>
Network alerts land in the same dashboard as host events and can be correlated: for example, a network rule fires on a web exploit, and a minute later a new PHP file appears on the same server. I described how the SIEM itself is built in Building a SOC on Wazuh from scratch.
Takeaways
- Suricata covers the blind spot of host logs — network attacks and suspicious traffic.
- Rules come from
suricata-updateon a schedule; noise is handled withdisable.conf. - Kibana is for trends and dashboards, EveBox for reviewing alerts one at a time.
- IDS interfaces belong behind a proxy with TLS and access restrictions.
- The biggest value comes from pairing it with a SIEM, where network events are correlated with host events.
- My conclusion after testing: for a company perimeter, a good NGFW is more practical — we tested products from almost every vendor, and the one I liked most was Palo Alto Networks. Suricata is great for labs, research and as an extra network sensor.