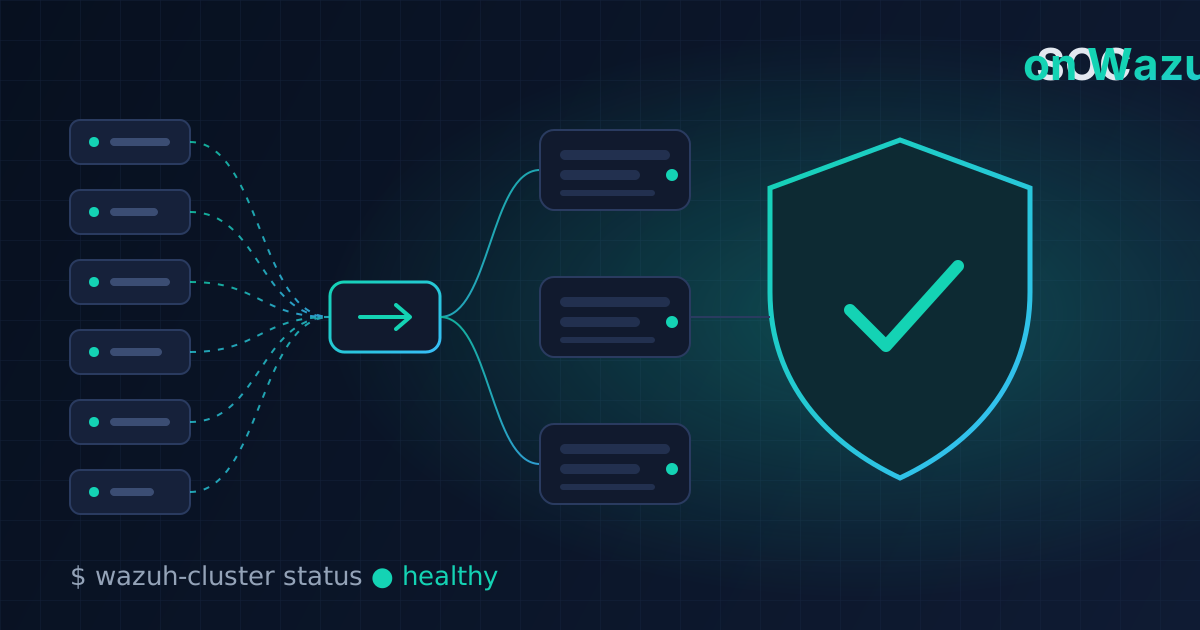
Building a SOC on Wazuh from scratch: a fault-tolerant cluster for 300+ agents
Cluster architecture, agent load balancing, securing the SOC itself, integrations — and the main pain of any SIEM: alert noise. Lessons from a rollout at a hosting company.
Translated from the Russian original. Русская версия
When a company runs hundreds of servers hosting thousands of customer websites, attacks never stop: password brute force, scanning, web shell uploads, CMS exploits. Without centralized monitoring you learn about a breach from a customer or an abuse report. I came to security from system administration and built a SOC at a hosting company from scratch. This article covers what came out of it, how it works, and the mistakes I made along the way.
All server names, IP addresses, accounts and internal details are replaced with placeholders. Numbers are rounded.
Why Wazuh
The requirements were simple: open source, no per-agent licensing, agents for Linux and Windows, ready-made detection rules, and room to grow to several hundred nodes. Wazuh covers all of that out of the box:
- SIEM — event collection and correlation, thousands of built-in rules and decoders;
- XDR features — file integrity monitoring (FIM), configuration assessment (SCA), software inventory and vulnerability detection, active response;
- agents for Linux, Windows and macOS, plus syslog ingestion from network devices;
- clustering for the server side and the OpenSearch-based indexer.
Wazuh has four components: agents on hosts, the server (analyzes events with decoders and rules), the indexer (stores and searches alerts) and the dashboard (web UI).
Architecture
An all-in-one server is fine for a test but not for hundreds of agents: you hit CPU limits on analysis and disk limits on indexing, and one machine going down takes all monitoring with it. So I planned a cluster from day one:
Agents (300+)
     │  1514/tcp events, 1515/tcp enrollment
     ▼
wazuh-lb ── HAProxy, leastconn
     │
     ├── wazuh-master   master server + dashboard
     ├── wazuh-node1    worker + indexer
     ├── wazuh-node2    worker + indexer
     └── wazuh-node3    worker + indexer

Users ──► edge-nginx (TLS + allow-list) ──► Wazuh dashboard, triage panel, OpenCVE
Key decisions:
- Agents only talk to the load balancer, never to a specific server. Nodes can be added and removed without touching the agents.
- Three indexer nodes — quorum and shard replicas: losing one node loses no data.
- All inter-node traffic stays on the private network. Only the load balancer (for agents) and the edge proxy (for people) face outward.
A sizing rule that worked for me: about 100 agents per node with 8 vCPU, 8 GB RAM and 200 GB of disk for 90 days of retention. Actual load depends heavily on how noisy your sources are — more on that below.
Installing the cluster
Wazuh ships an install script and a config file that describes every node:
curl -sO https://packages.wazuh.com/4.11/wazuh-install.sh
curl -sO https://packages.wazuh.com/4.11/config.yml
nodes:
  indexer:
    - name: wazuh-in1
      ip: "10.0.0.5"
    - name: wazuh-in2
      ip: "10.0.0.6"
    - name: wazuh-in3
      ip: "10.0.0.8"
  server:
    - name: wazuh-master
      ip: "10.0.0.4"
      node_type: master
    - name: wazuh-worker1
      ip: "10.0.0.5"
      node_type: worker
    - name: wazuh-worker2
      ip: "10.0.0.6"
      node_type: worker
  dashboard:
    - name: dashboard
      ip: "10.0.0.4"
The script then generates certificates and passwords for the whole cluster (wazuh-install.sh --generate-config-files), the archive is copied to every node, and components are installed in order: indexers, indexer cluster initialization, servers, dashboard. Tip: store the generated certificate archive somewhere safe — you will need it to add nodes later.
Load balancing agents with HAProxy
Agents use two ports: 1515/tcp for enrollment and 1514/tcp for sending events. Both are balanced in TCP mode:
frontend wazuh_register
    mode tcp
    bind :1515
    default_backend wazuh_register

backend wazuh_register
    mode tcp
    balance leastconn
    server master  10.0.0.4:1515 check
    server worker1 10.0.0.5:1515 check
    server worker2 10.0.0.6:1515 check

frontend wazuh_reporting
    mode tcp
    bind :1514
    default_backend wazuh_reporting

backend wazuh_reporting
    mode tcp
    balance leastconn
    server master  10.0.0.4:1514 check
    server worker1 10.0.0.5:1514 check
    server worker2 10.0.0.6:1514 check
leastconn sends each new connection to the node with the fewest active connections. Agents keep long-lived connections, so round-robin would spread them unevenly. To add and remove backend nodes automatically, the HAProxy Dataplane API (Wazuh has a helper for it) is useful — but its API should only listen on a local address.
Securing the SOC itself
A SIEM is a juicy target: it sees the entire infrastructure and has agents on hundreds of servers. So the cluster follows a default-deny policy:
- A firewall on every node (CSF in my case): inbound ports are closed, with exceptions only for the cluster’s private subnet and corporate VPN addresses. Outbound traffic is limited to what is needed (DNS, NTP, HTTPS for updates).
- SSH with keys only, password login disabled.
- Web interfaces are never exposed directly. The Wazuh dashboard, the triage panel and OpenCVE are published through a separate edge-nginx that terminates TLS and only admits allow-listed IPs. Backends listen on private addresses.
- Password-protected agent enrollment. Without it, anyone who knows the load balancer address can enroll “their own” agent and pollute your data:
<auth>
  <use_password>yes</use_password>
</auth>
The password goes into /var/ossec/etc/authd.pass on every server node with mode 640 and owner root:wazuh.
Agent groups
Servers at a hosting company are very different: shared hosting, internal web apps, network devices, office workstations. They need different collection rules and tolerate different amounts of noise. Wazuh lets you put agents into groups and push a separate agent.conf to each group. An agent can belong to several groups and be moved between them without reinstalling:
/var/ossec/bin/agent_groups -a -i <AGENT_ID> -g webapp -q          # add to a group
/var/ossec/bin/agent_groups -r -i <AGENT_ID> -g shared-hosting -q  # remove from the old one
/var/ossec/bin/agent_groups -S -i <AGENT_ID>                        # check sync status
A lesson I learned: “the agent is connected” does not mean “the right events are arriving.” On RHEL-like systems (CloudLinux, AlmaLinux) successful SSH logins are written to /var/log/secure, and the default configuration did not collect that file — Wazuh saw audit events but not the logins themselves. One block in the group config fixed it:
<localfile>
  <log_format>syslog</log_format>
  <location>/var/log/secure</location>
</localfile>
After changing group configs, validate them with verify-agent-conf and spot-check the active configuration on agents. And always test: perform an action that should trigger an alert and make sure the alert actually shows up.
Integrations and vulnerability tracking
Wazuh is a great hub, but it doesn’t cover everything on its own. What I tried and where I ended up:
- Suricata (network IDS). I set it up and tested it: the Wazuh agent reads
eve.json, so network alerts land in the same dashboard as host events. I described the setup in a separate article on Suricata + ELK. But my conclusion after testing: for protecting a company perimeter, a good NGFW is more practical — it sees the traffic and blocks it right away, while a home-grown IDS stack needs constant attention. We tested NGFWs from practically every vendor on the market, and the one I liked most was Palo Alto Networks. - DefectDojo — vulnerability management. Wazuh finds vulnerable software on agents, but tracking the work (who fixes what, what is risk-accepted, what is closed) is easier in a dedicated system. To move findings over I wrote wazuh-to-dojo. DefectDojo ran for a while, but for our scale it proved too heavy: importing hundreds of thousands of findings crashed it with OOM. In the end I replaced it with my own triage panel — more on that below.
- OpenCVE — tracking new CVEs for the products actually used in the infrastructure.
The real pain: alert noise
After a few months I took a snapshot and realized the SIEM had become a firehose rather than an incident queue:
- millions of alerts a day, dozens per second;
- two rules produced about three quarters of the weekly volume, three rules almost 90%;
- even high-level alerts (
level >= 10) were almost entirely web correlations on shared hosting: scanners and bots hit customer sites around the clock.
Reading that by eye is pointless, and pushing everything into an incident management system means millions of “cases”. The answer is a layered model:
- Collection and normalization. Sources are split by type (web hosting, databases, applications, network gear, workstations), and the expected noise level is known for each.
- Suppression. Low-value rules are set to
level=0or excluded; cache, log and temp paths are removed from integrity monitoring; generic web rules on shared hosting are toned down. The telemetry still stays in the index for searching. - Correlation into “incident candidates”. An alert becomes a candidate only when conditions combine: for example, brute force + an unusual account + an external source + a critical asset; or a file change in a critical path + an unexpected process + a production server.
- Enrichment for candidates only: asset criticality, owner, GeoIP/ASN and reputation, vulnerability context, related events.
- Cases in the response system — only what passes every filter.
The main takeaway: a SIEM’s value is defined not by how many events it collects but by the quality of what reaches a human. Tuning noise is not a one-off task, it is ongoing work.
What running it taught me
After a year in production I had a few complaints about Wazuh itself that are worth knowing upfront:
- A conflict with Imunify360. On hosting servers that run Imunify360, the Wazuh agent conflicts with it. For a hosting company where Imunify360 is one of the main server protection tools, that’s a serious problem.
- Stale vulnerabilities in the dashboard. The vulnerability detection module sometimes doesn’t clear a finding after a package update: the package is already updated, yet the vulnerability keeps hanging in the dashboard. For triage that means wasted work — every finding has to be re-checked.
So I’m now considering a move to Elastic Security. The architectural principles in this article — load balancing, securing the SOC itself, source groups, fighting noise — don’t depend on the product and carry over as is.
What’s next
Vulnerability tracking has already moved to my own triage panel, Qalqan: it collects vulnerabilities from servers, enriches them with CVSS, EPSS and CISA KEV data, and filters out false positives when a vendor has already fixed the issue via a backport. The next step is automating triage and SOC incident handling with AI: with thousands of servers, manual vulnerability triage means hundreds of person-days, and a small team can’t get through it without automation.
Takeaways
- A Wazuh cluster with a load balancer in front of the agents scales by adding nodes and survives the loss of one.
- The SOC itself must be protected at least as well as the rest of the infrastructure: closed ports, VPN, TLS, a password for agent enrollment.
- Agent groups let you keep different rules for different server types — and always verify that the events you need actually arrive.
- Vulnerability tracking belongs outside the SIEM — and the tool has to handle your volume; when DefectDojo couldn’t keep up, my own panel did.
- Check that the SIEM agent is compatible with the rest of your server protection before a mass rollout.
- The hardest part is not installing a SIEM but making it show incidents instead of noise.
If you are building something similar and want to discuss the architecture, message me on Telegram.